STAY ON TRACK.
v20250723.1
TimeScaler is a multiple project management application. The images below show TimeScaler's work of scheduling two international projects for a company within two regions. There are a total of 155 resources across 85 tasks at 11 locations (5 Europe, 5 APAC, 1 global HQ).
Provided with only the resource skills and costs, task durations and dependencies, and locations for both sets of project sites, TimeScaler generates 687 resource-task assignments, providing several key features to keep projects on track.
Know What is Critical
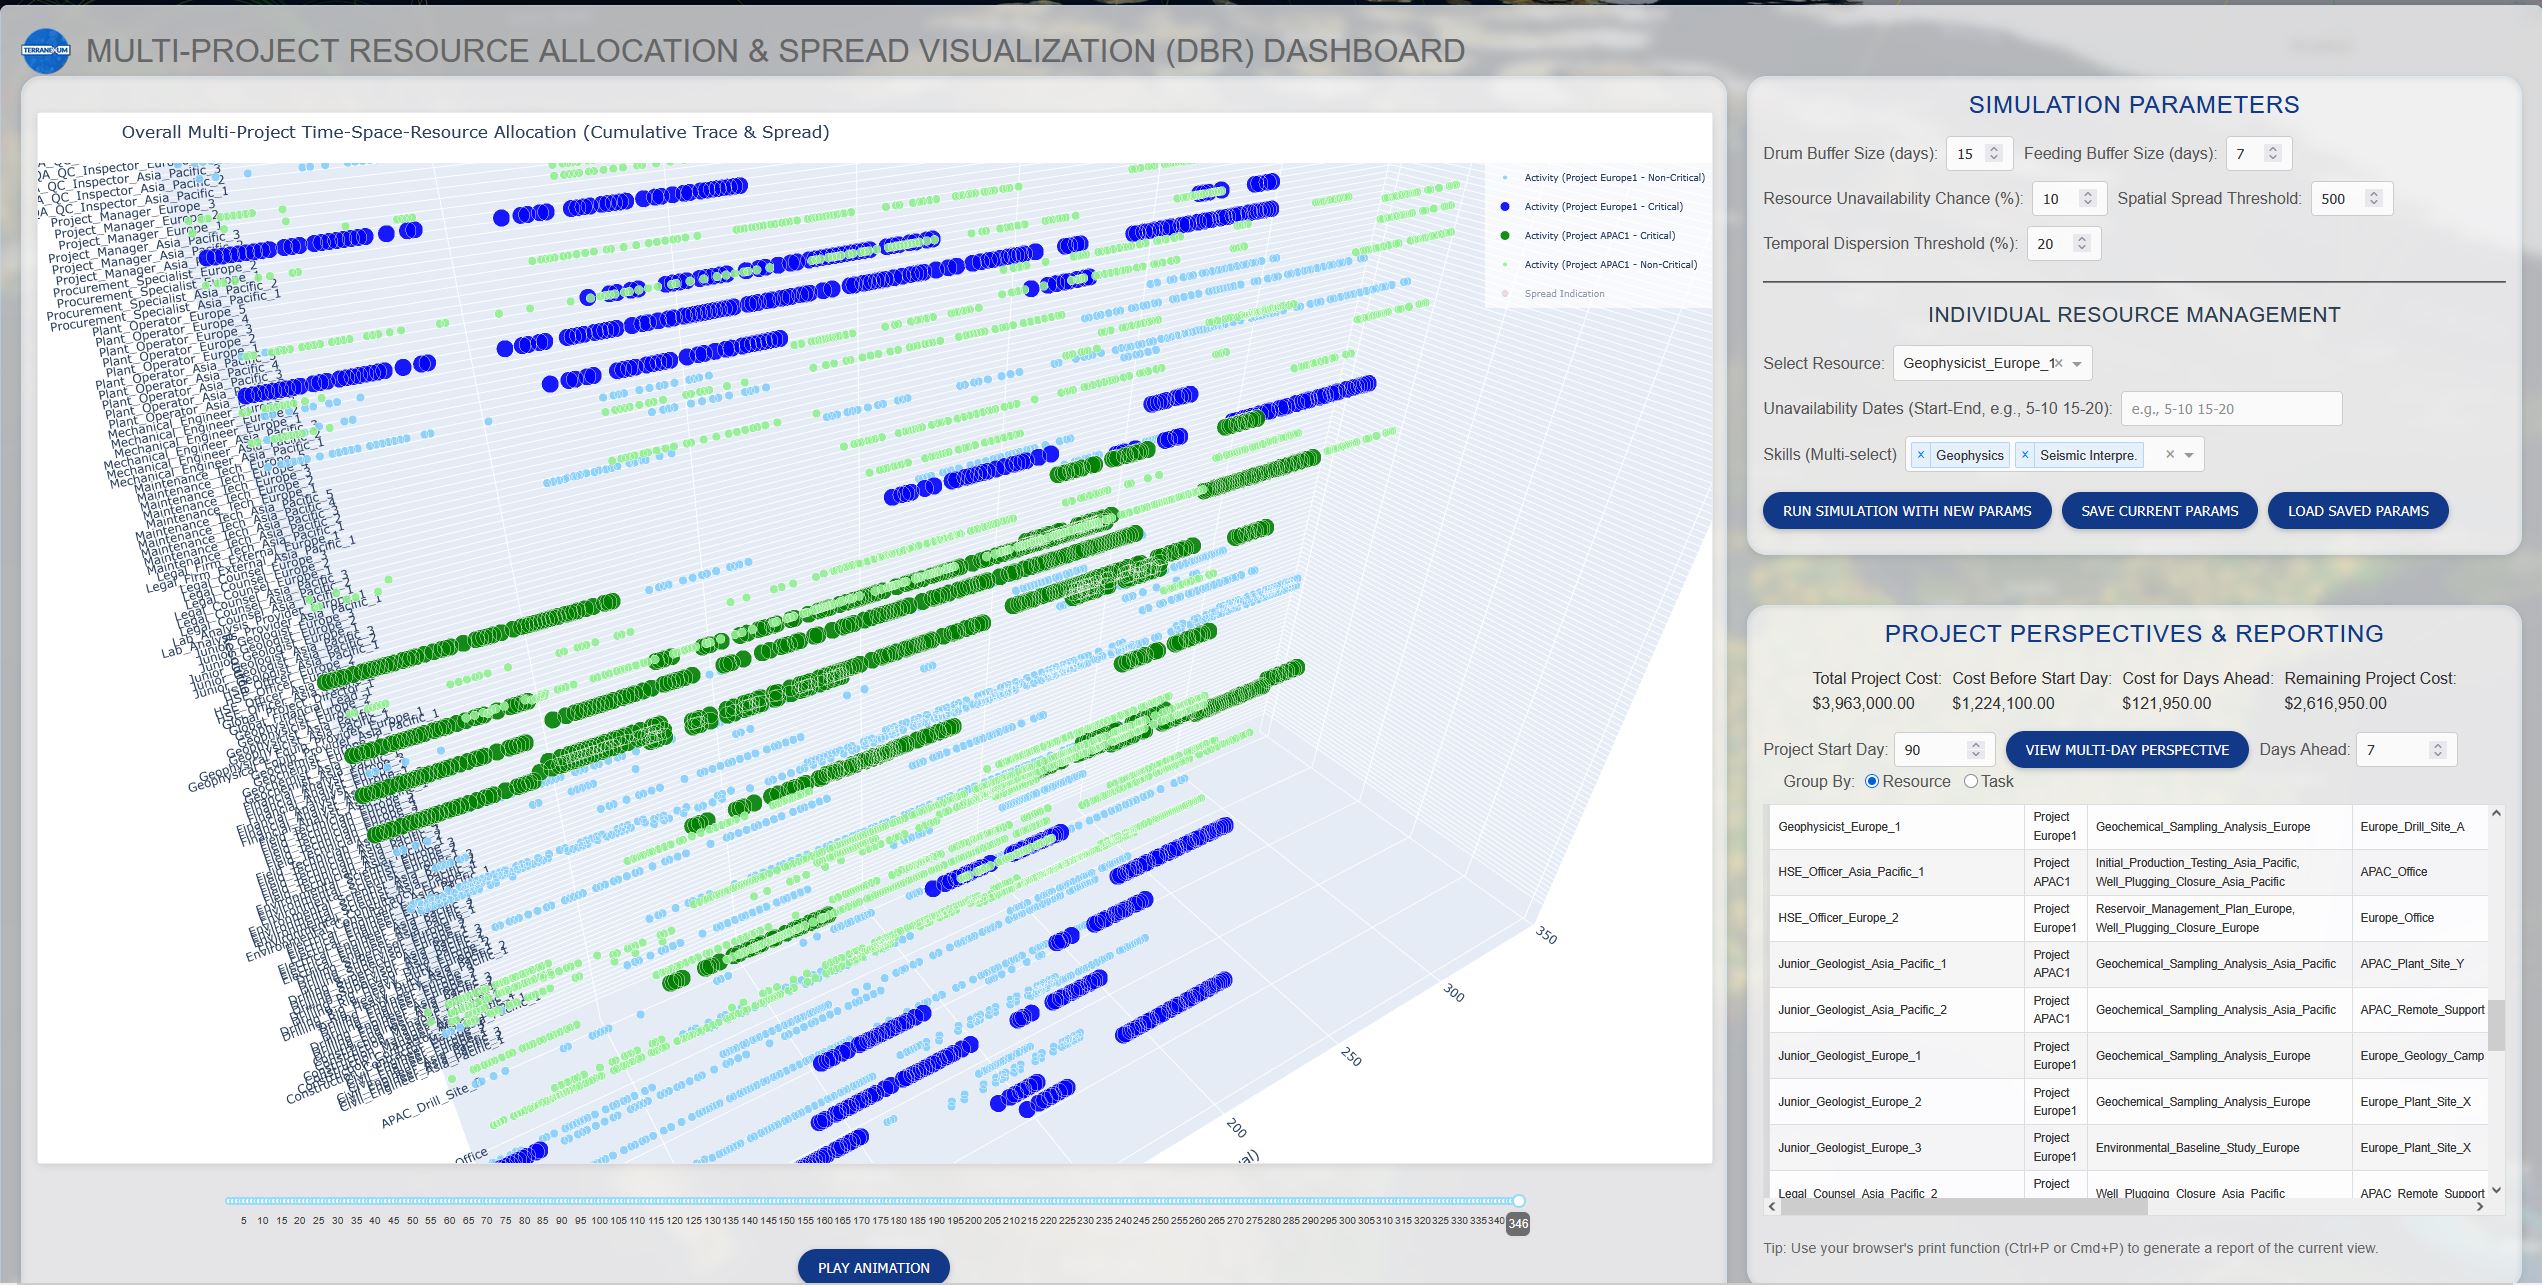
Deselecting the Spread Indication legend entry brings up this view of critical tasks (darker, larger markers) and non-critical tasks (smaller, lighter markers). A light and dark set of a single color denotes a single project.
What to Watch Ahead For
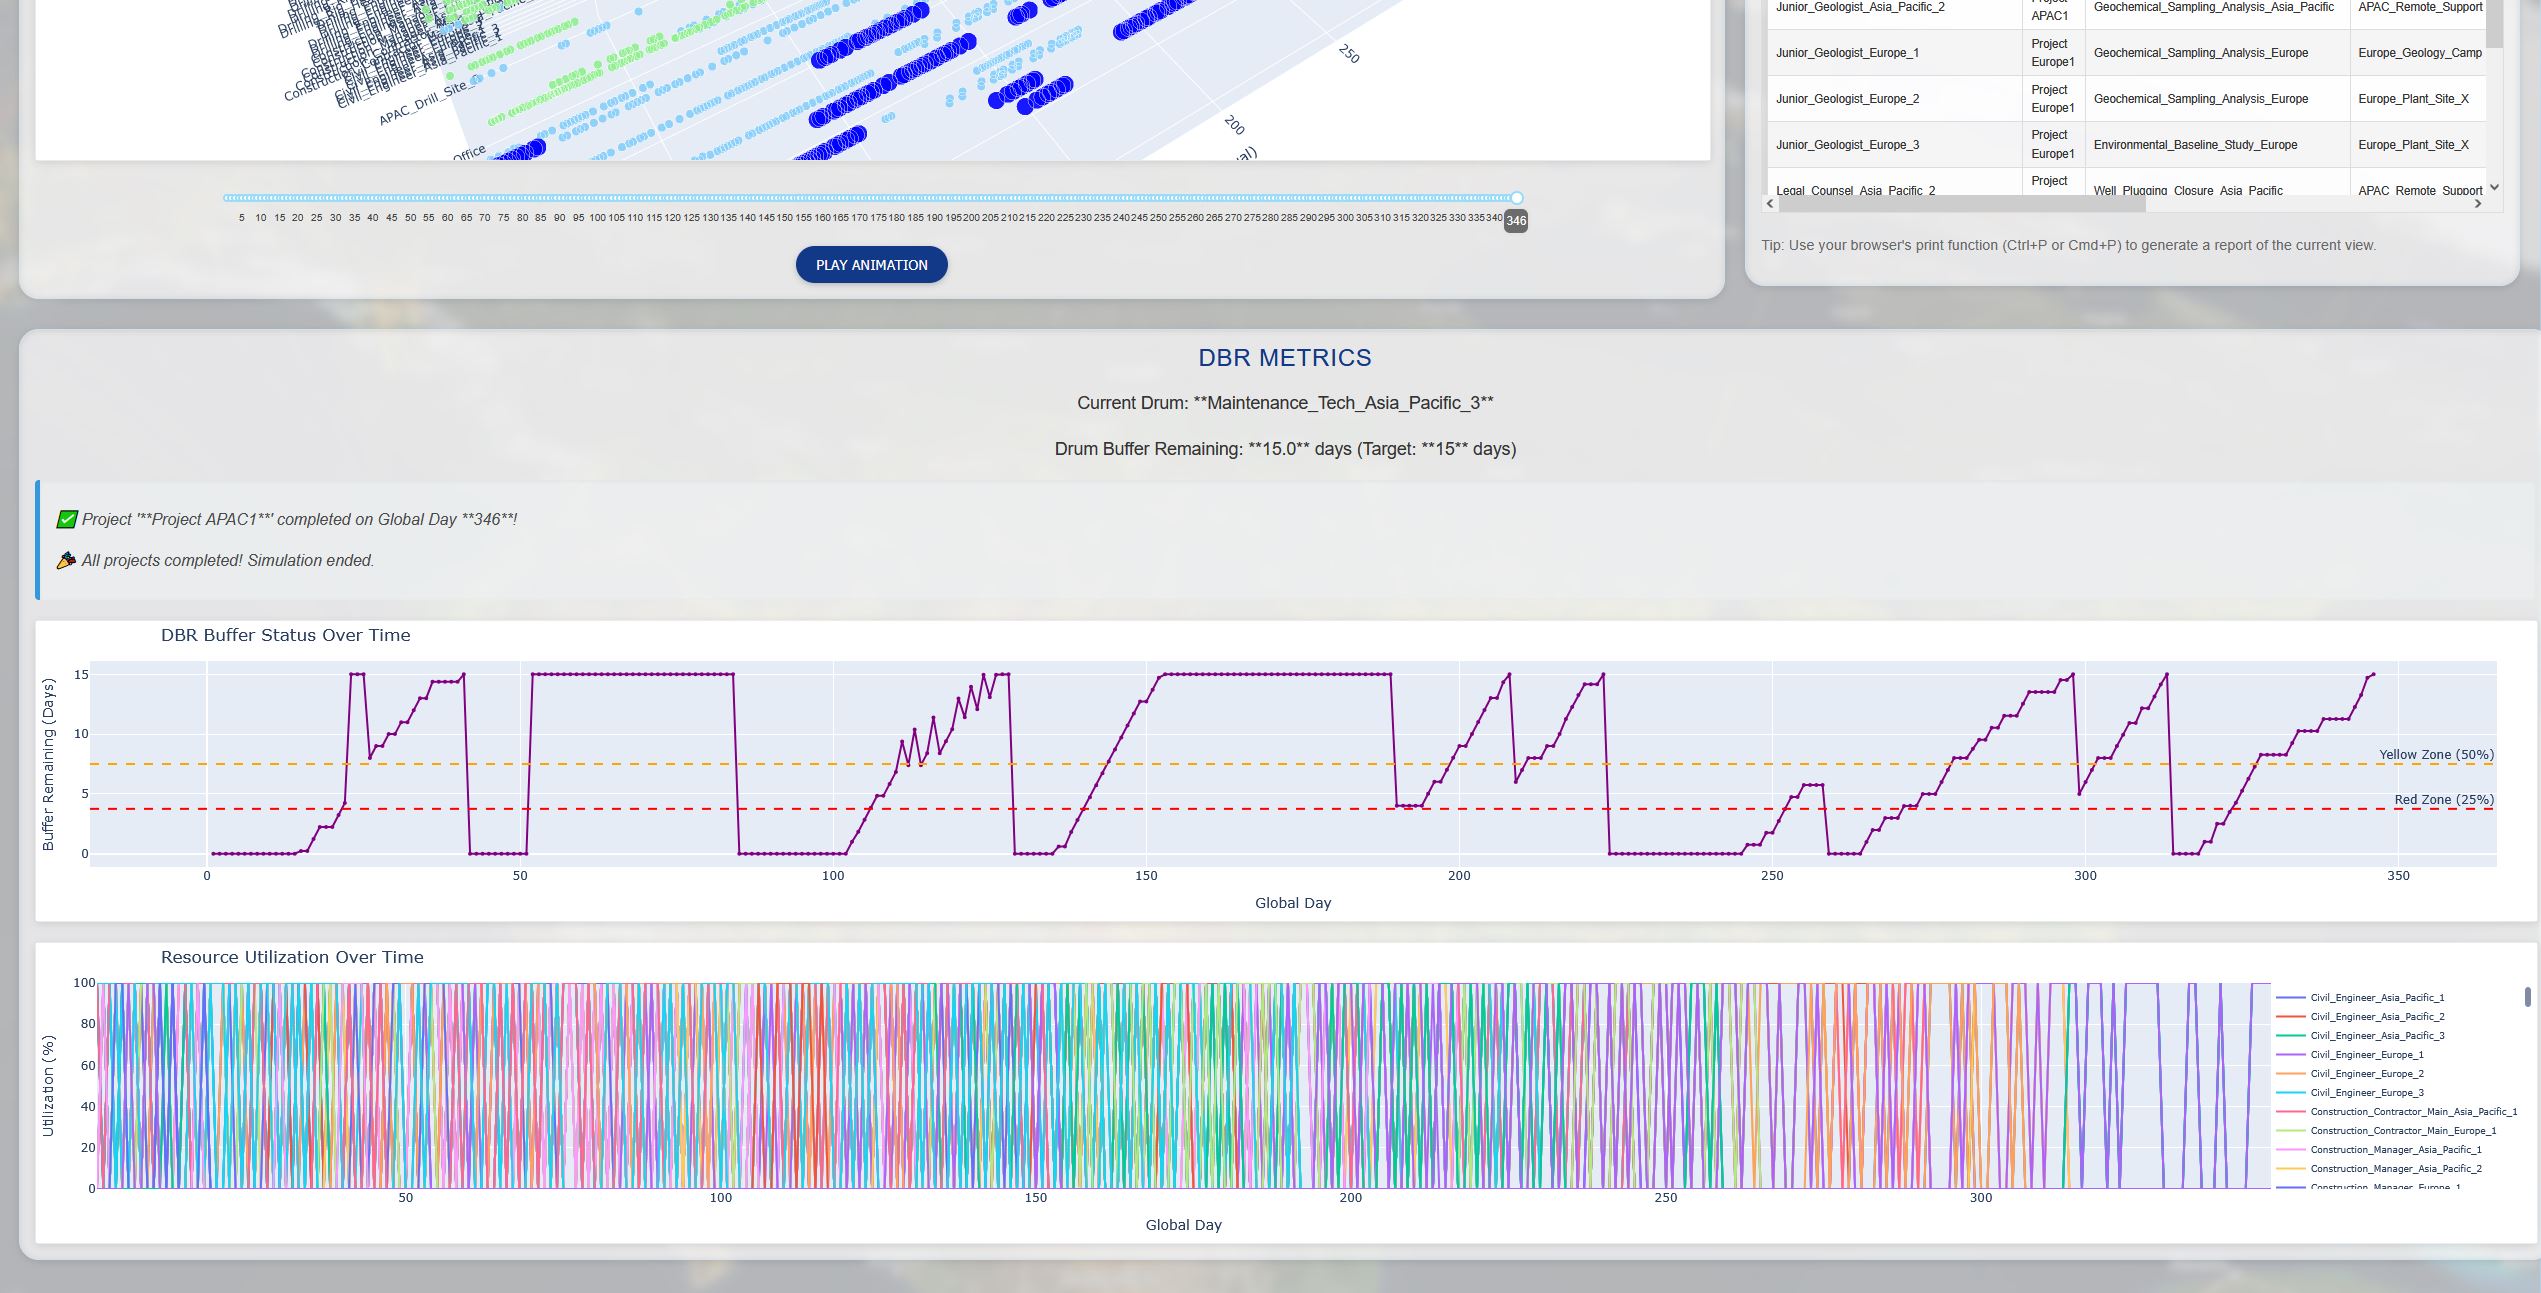
Below the main window is DBR information pertaining to how much buffer time is left, followed by a location where alerts for a day will appear. The day is adjustable using the slider from the 3D plot above, which will update all plots on the page.
The last two plots show the distribution of heavy days for resources, followed by a per-resource view of utilization over time. The entire legend can be toggled off so that single resources or several can be visible. Mousing over their lines at the top will display a popup with when they have tasks scheduled.
The Date of Reward
Every project should always have a revenue realization date for all resources to work toward. The earliest it can be is the last day of all critical tasks. Test various scenarios of buffer time, resource unavailability, and how much project spread risk over time or space you are willing to work with.
How TimeScaler Improves Project Management
TimeScaler employs the Drum-Buffer-Rope (DBR) approach. DBR improves on the Critical Chain approach in a manufacturing context where multiple projects are involved. We found it appropriate since growing industries requires manufacturing in a way - an assembly line of projects was what we had imagined for geothermal energy, for example.
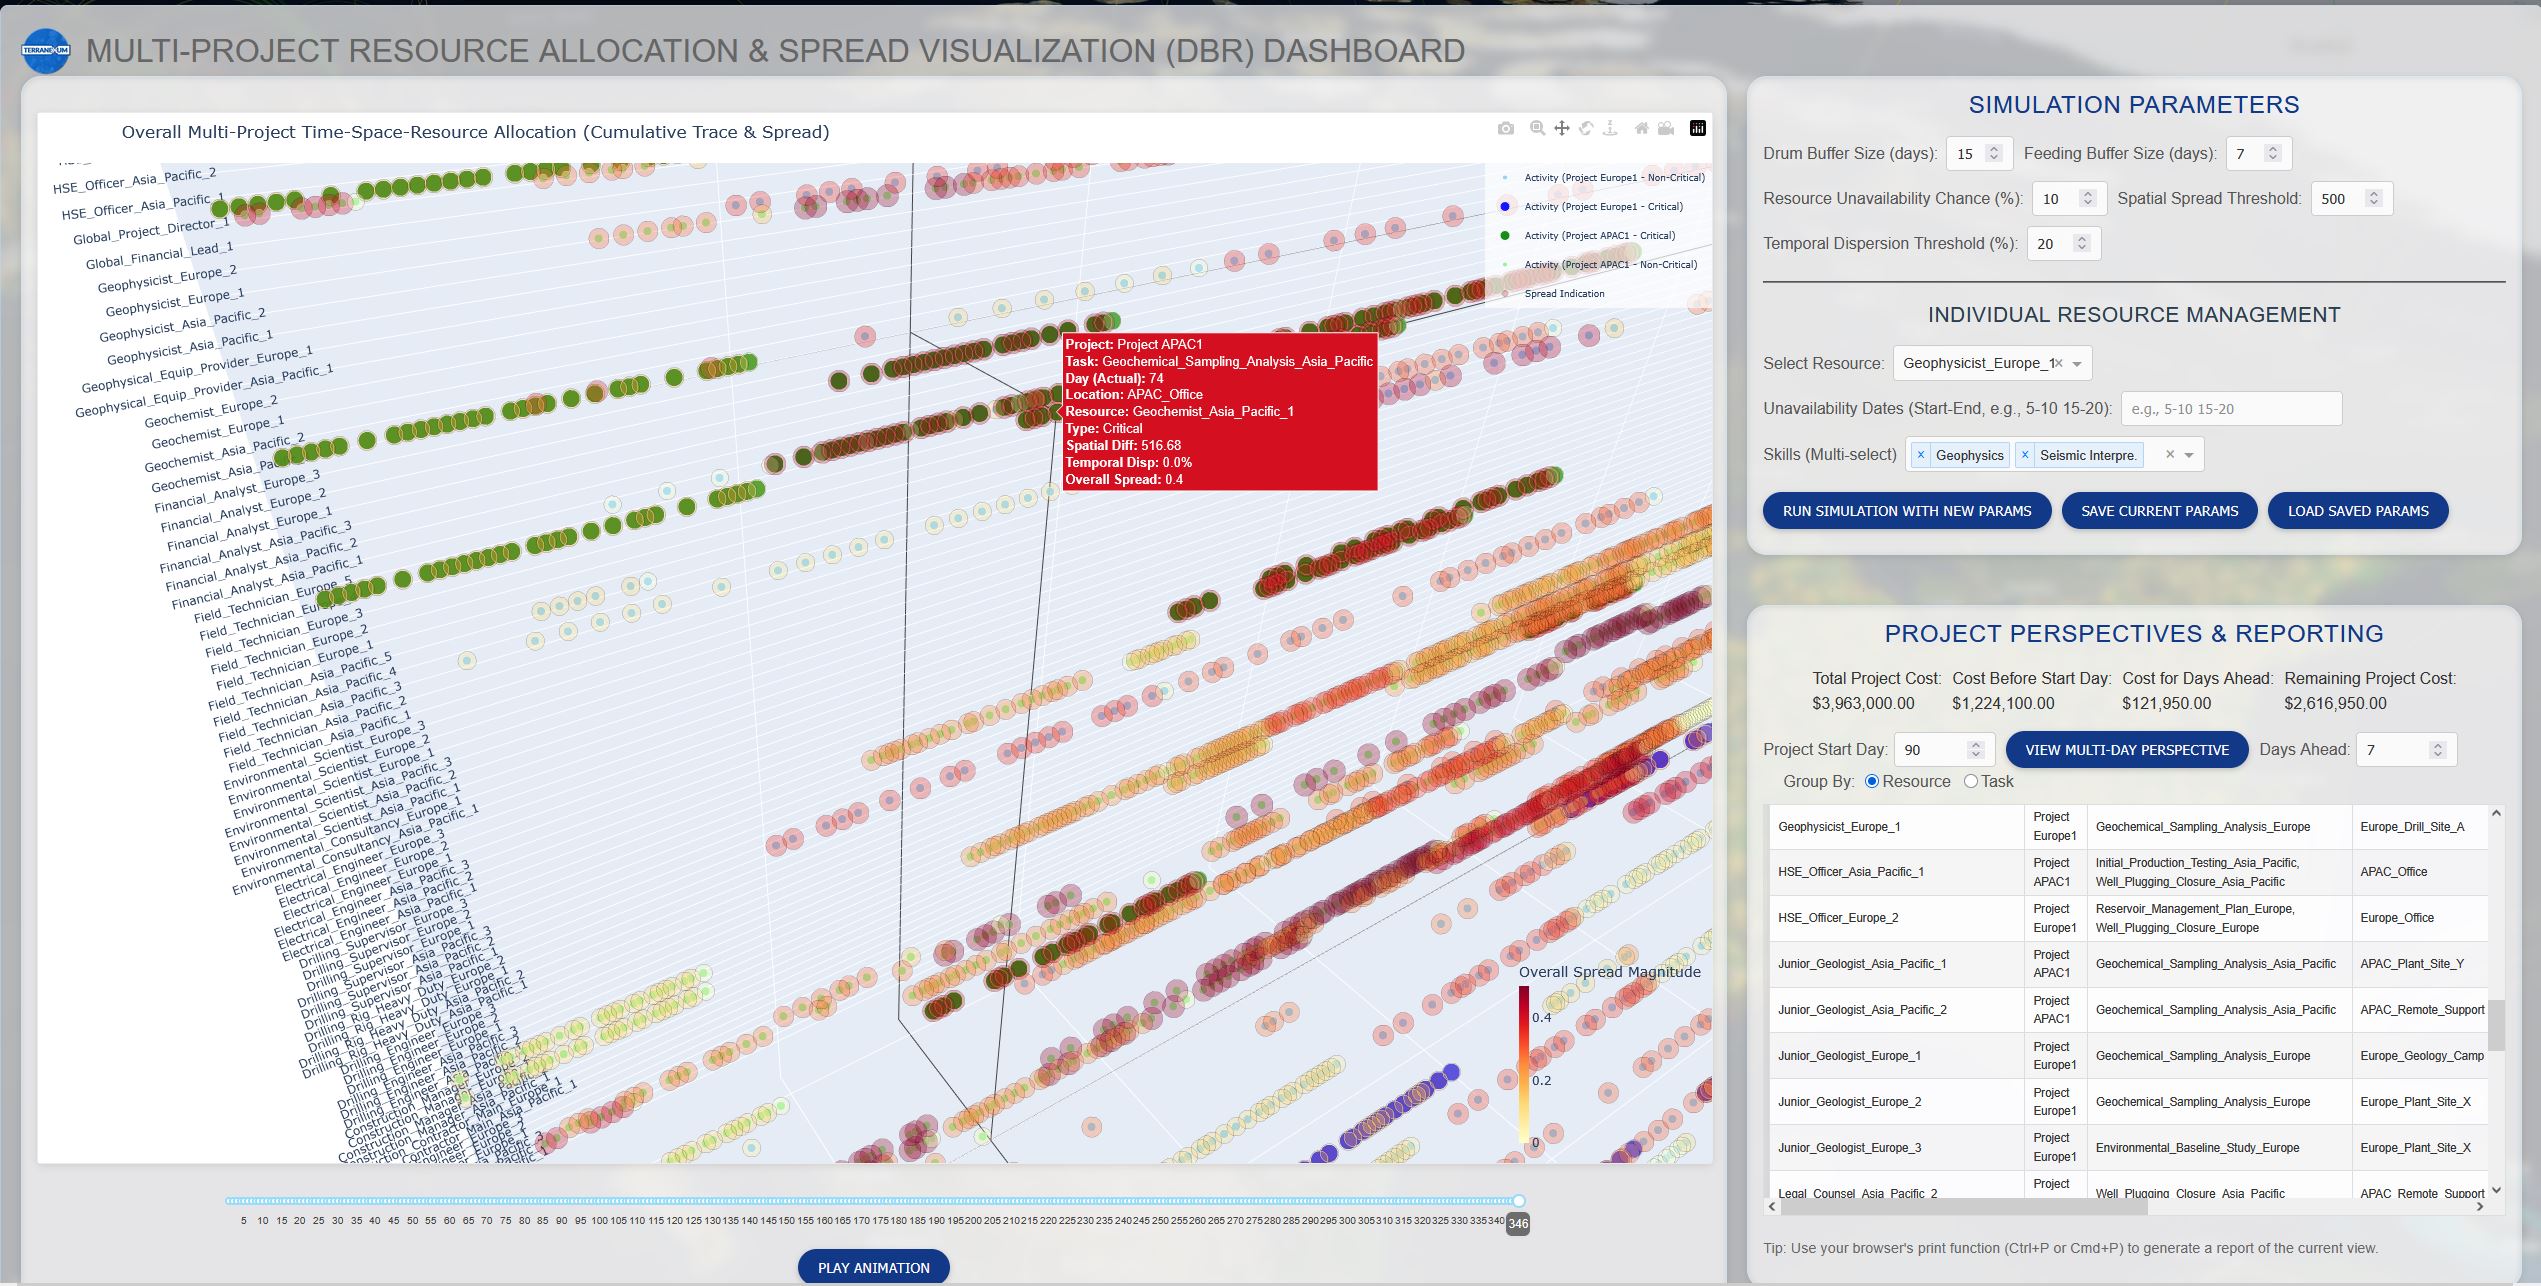
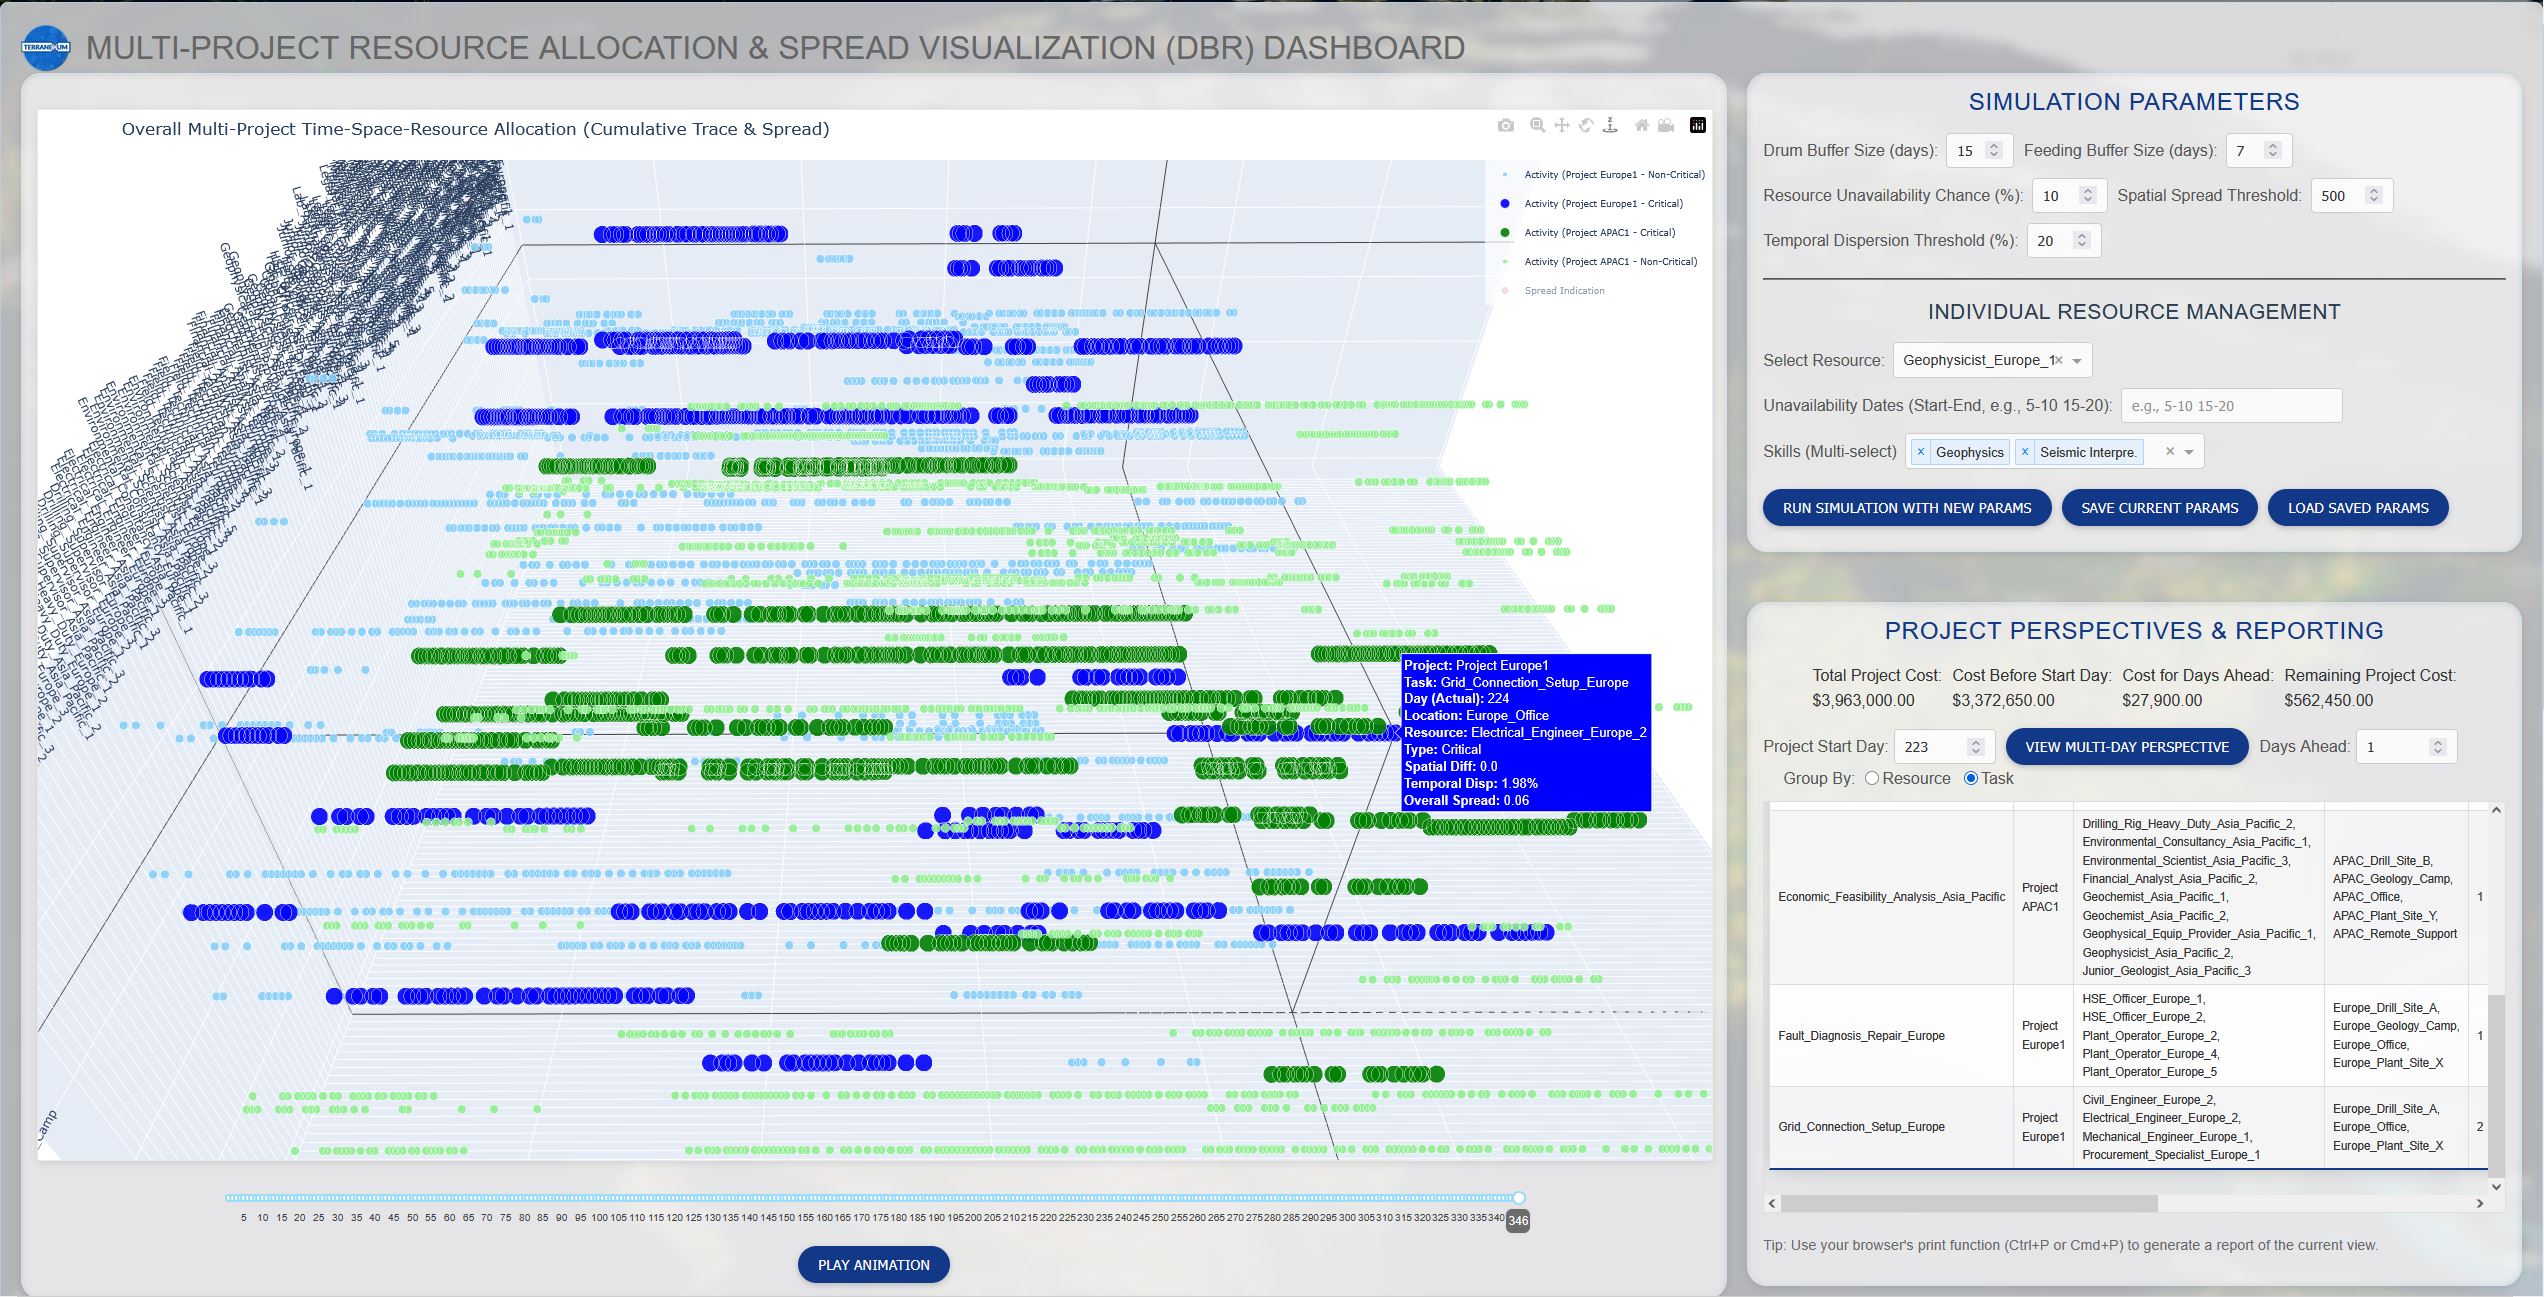
Test various scenarios of buffer time, resource unavailability, and how much project spread risk over time or space you are willing to work with. This latter quantity is how we improve on DBR, using our wave packet-inspired spread overlay. We are able to quantify higher-risk days for delays where there is high 1) "spatial diffraction": more resources are spread across more locations for a task, or 2) "temporal dispersion": a task has taken longer by a date compared to how long it was estimated to take.
Visualization Features
- Any angle is possible to view our 3D plot from, zoomed in or out, panned, or rotated.
- Any legend entry can be selected to toggle it on or off, or all off to isolate just one entry from the rest.
- Any data point can be moused over for more details.
- Any resource, task, and assignment following our structure can be scheduled as any other resource, though we show only people below, and only their per-day costs as project costs