MODELING COMPLEX
The Millennium Footbridge in London suffered from pedestrian-induced oscillations. Stability wasn't restored by people changing how they walked, nor what they walked on. But with several tuned external dampers.
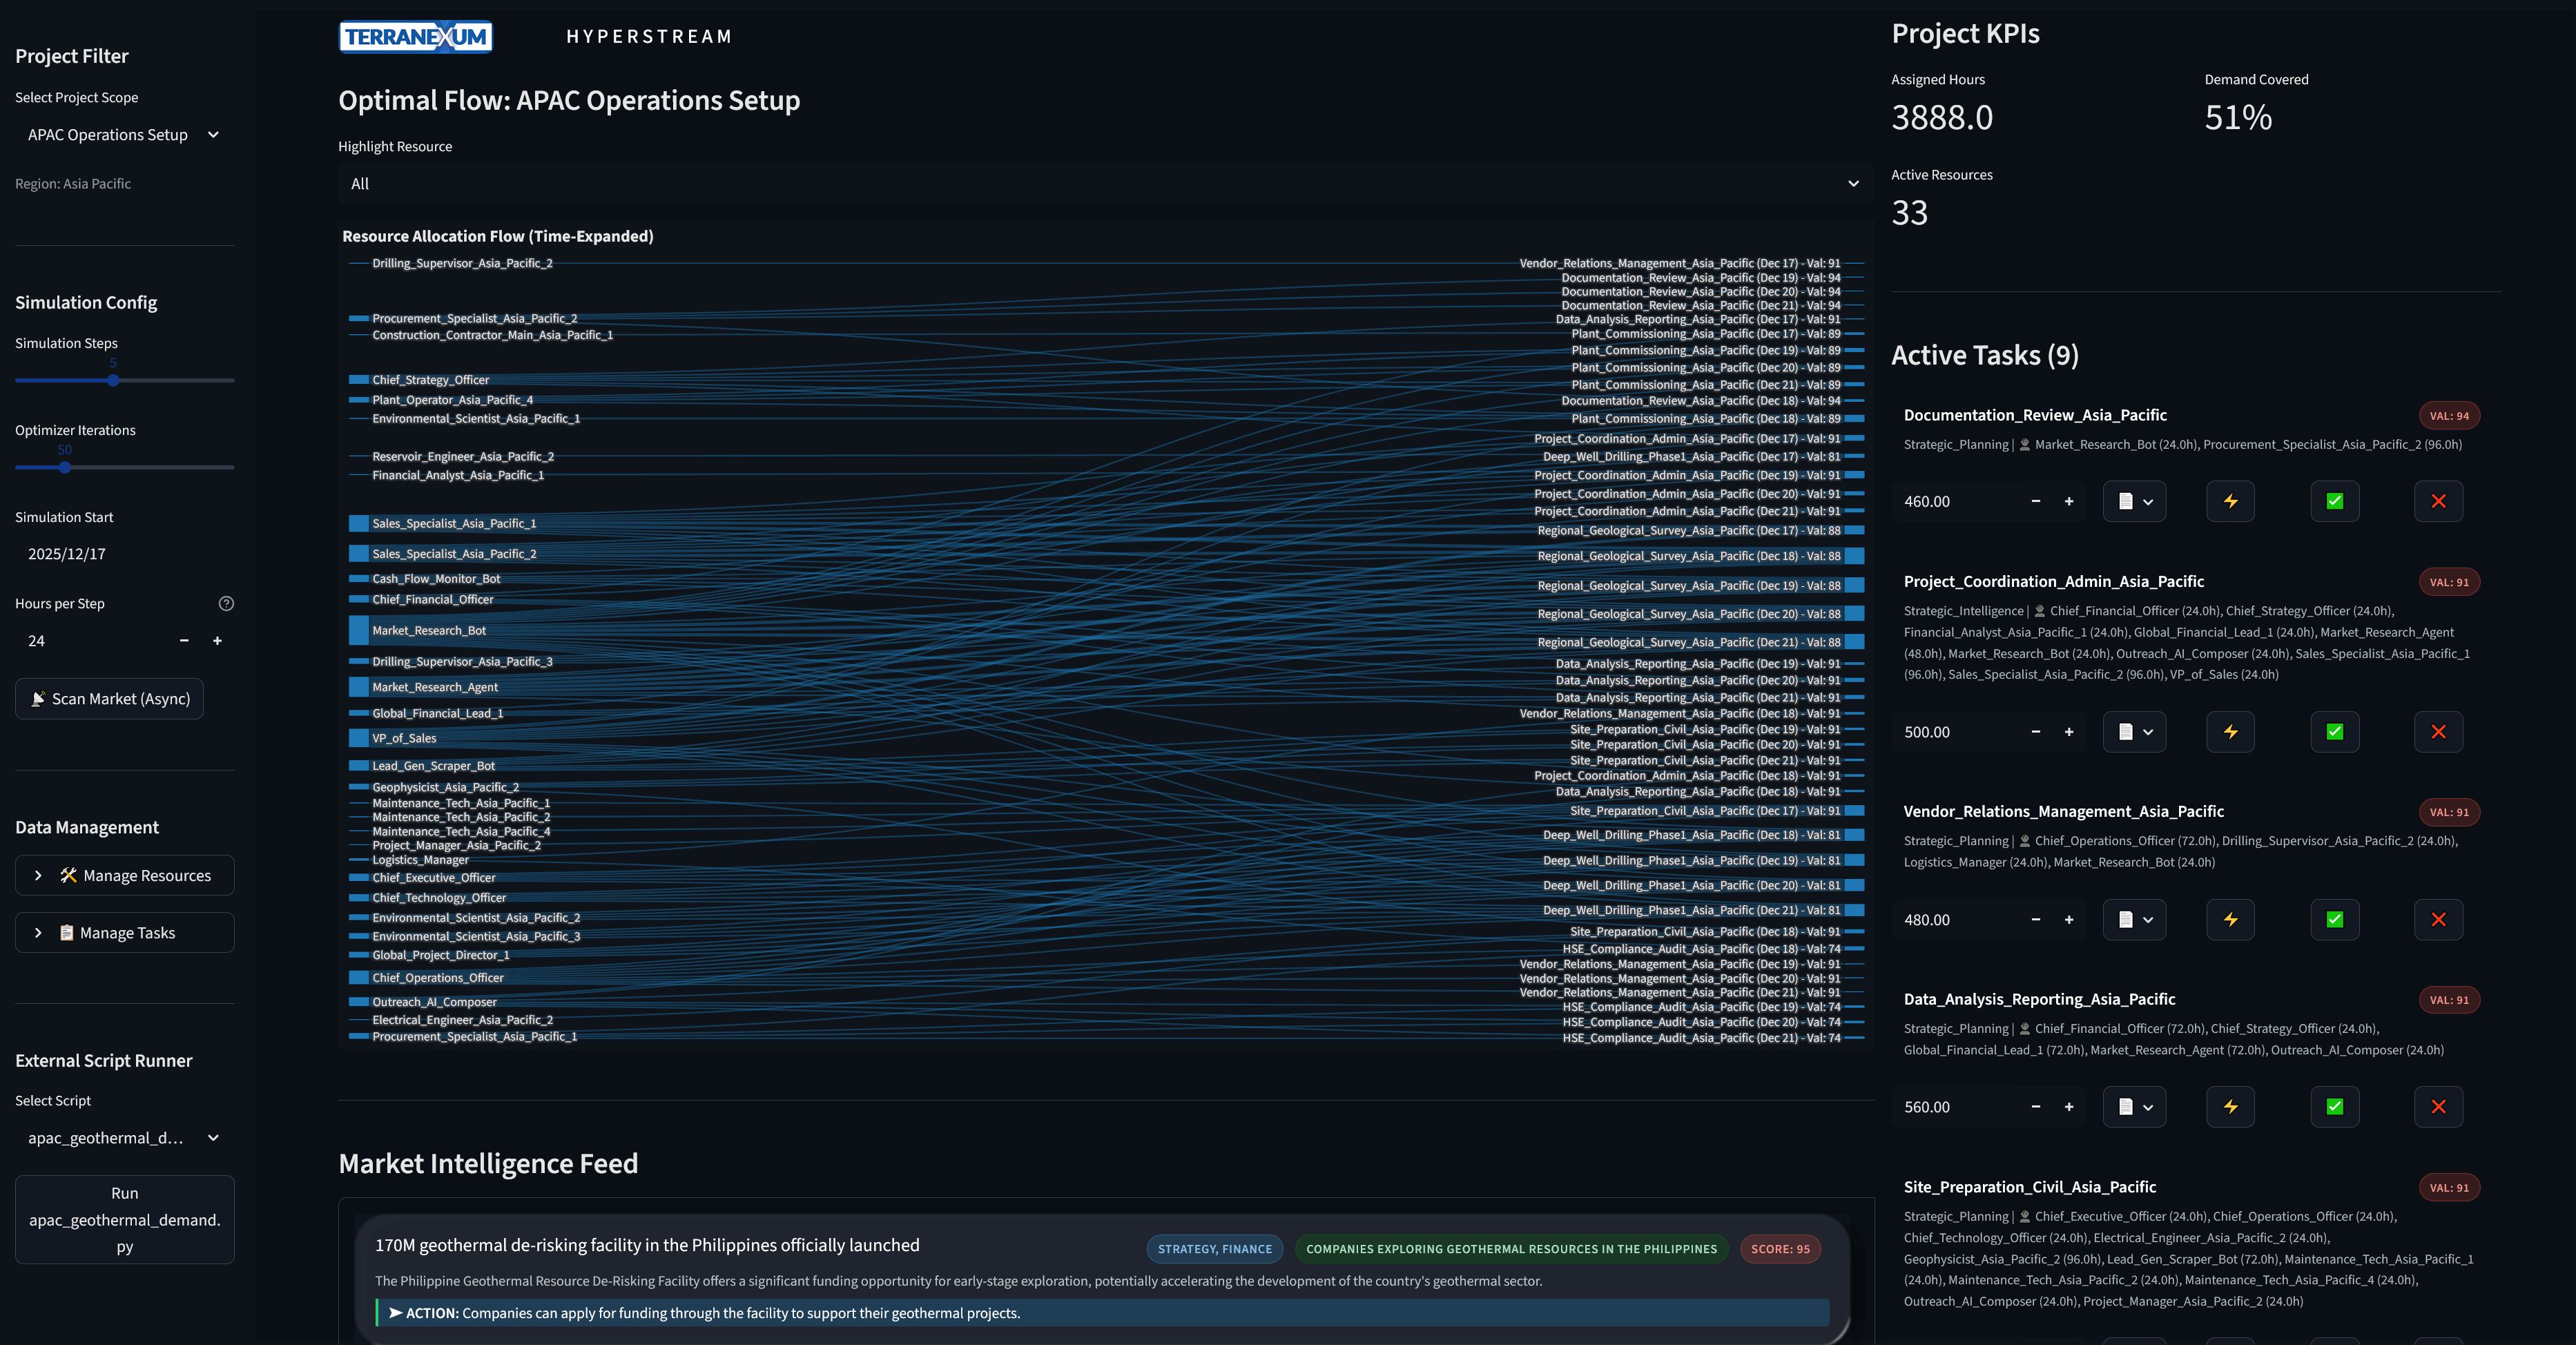
Modeling where and when damping (or regenerative braking) could help across multiple complex systems requires an inclusive modeling of both data (knowns) and missing data (as known unknowns).
As only together can one model a range of possible interactions that may otherwise fall under the scope of unknown unknowns - nonlinearities that give rise to unanticipated outcomes, instabilities, and failures.
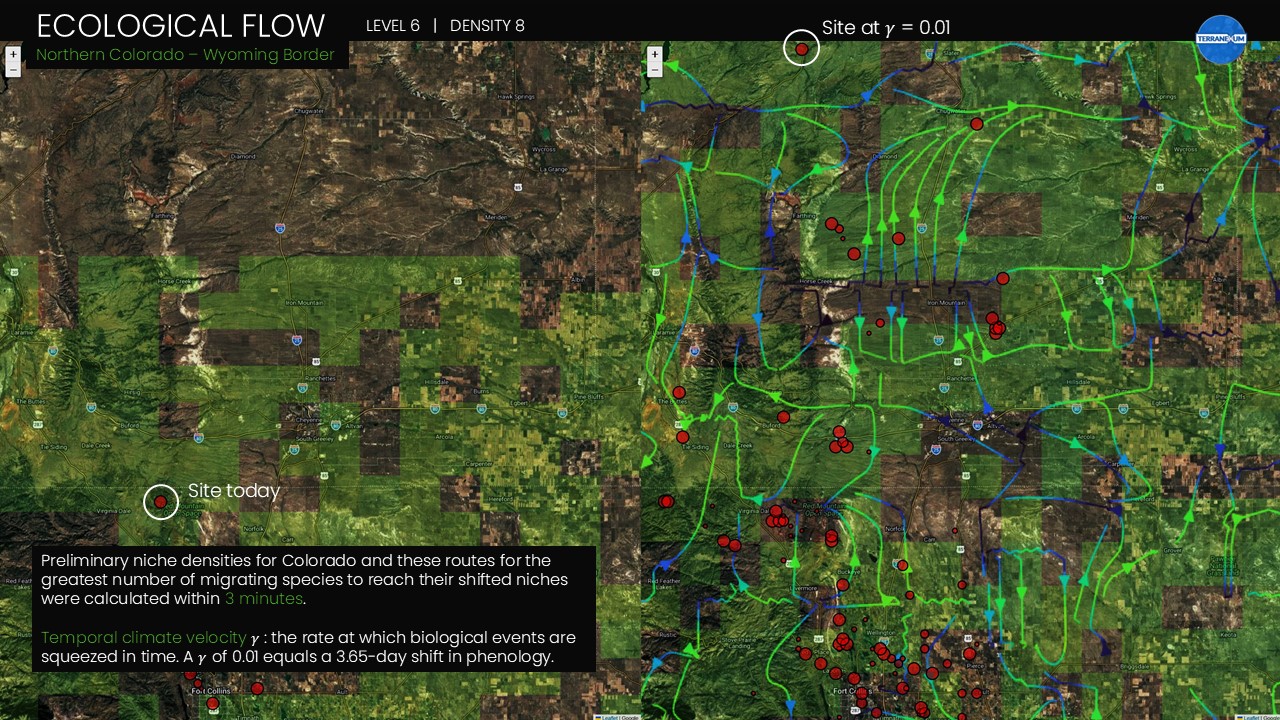
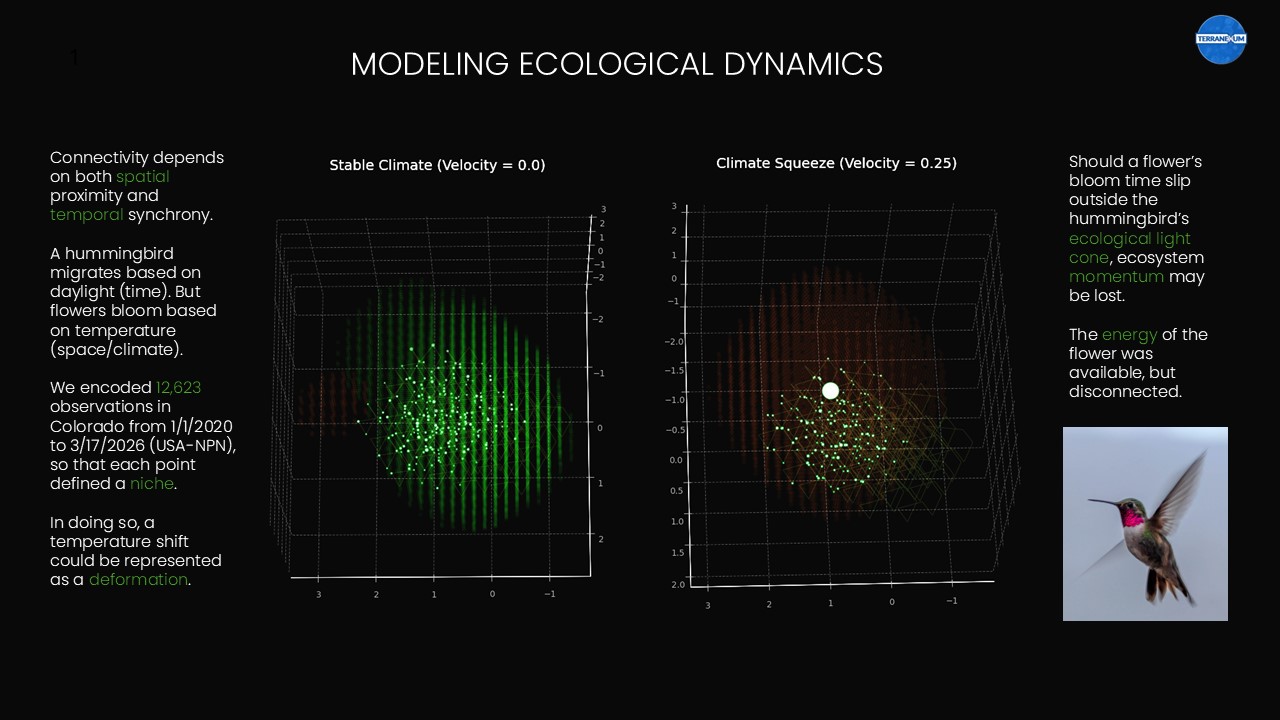
A healthy meadow has observable species (knowns). In the above example, we used species observations to define a range of discrete niches, each with a separate energy and momentum and occupying different spaces and times.
These niches are known unknowns. Our model specifies them, but it is unknown if a species occupies it.
If a noxious weed begins to spread, it must have found an available niche. That niche becomes known.
What interactions might result...it is why we worked toward better modeling. To inform better designs.
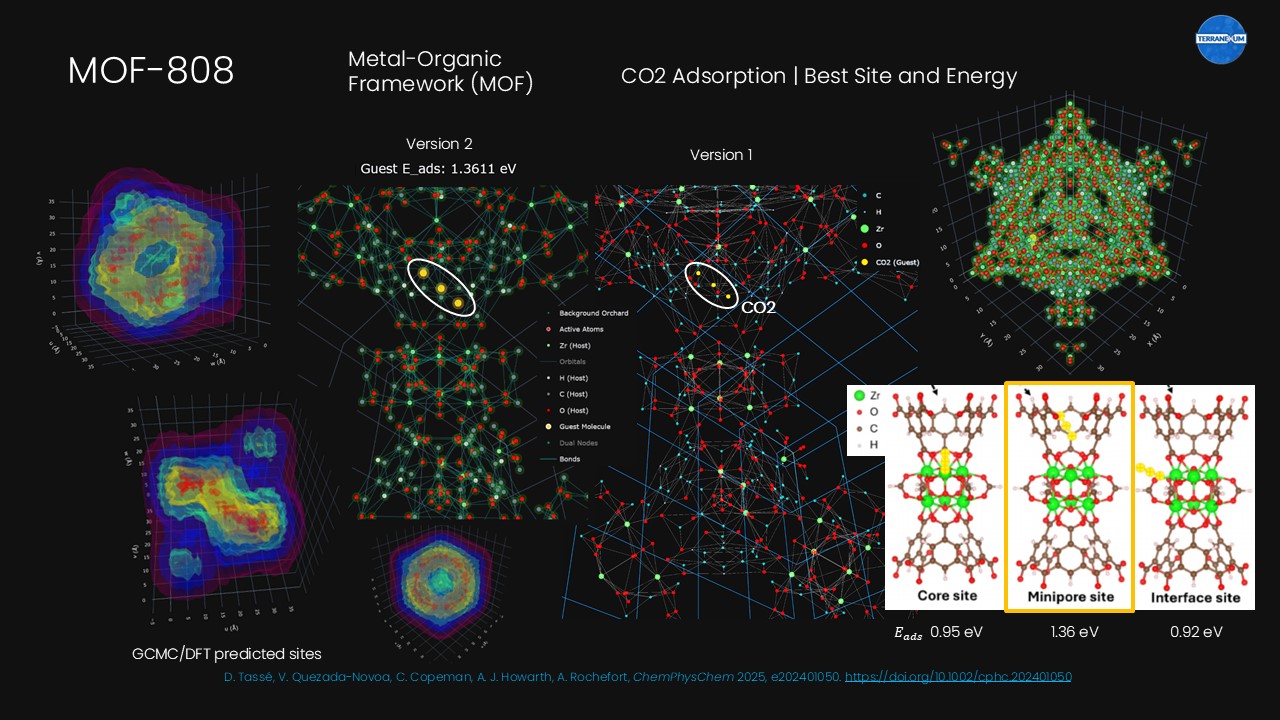
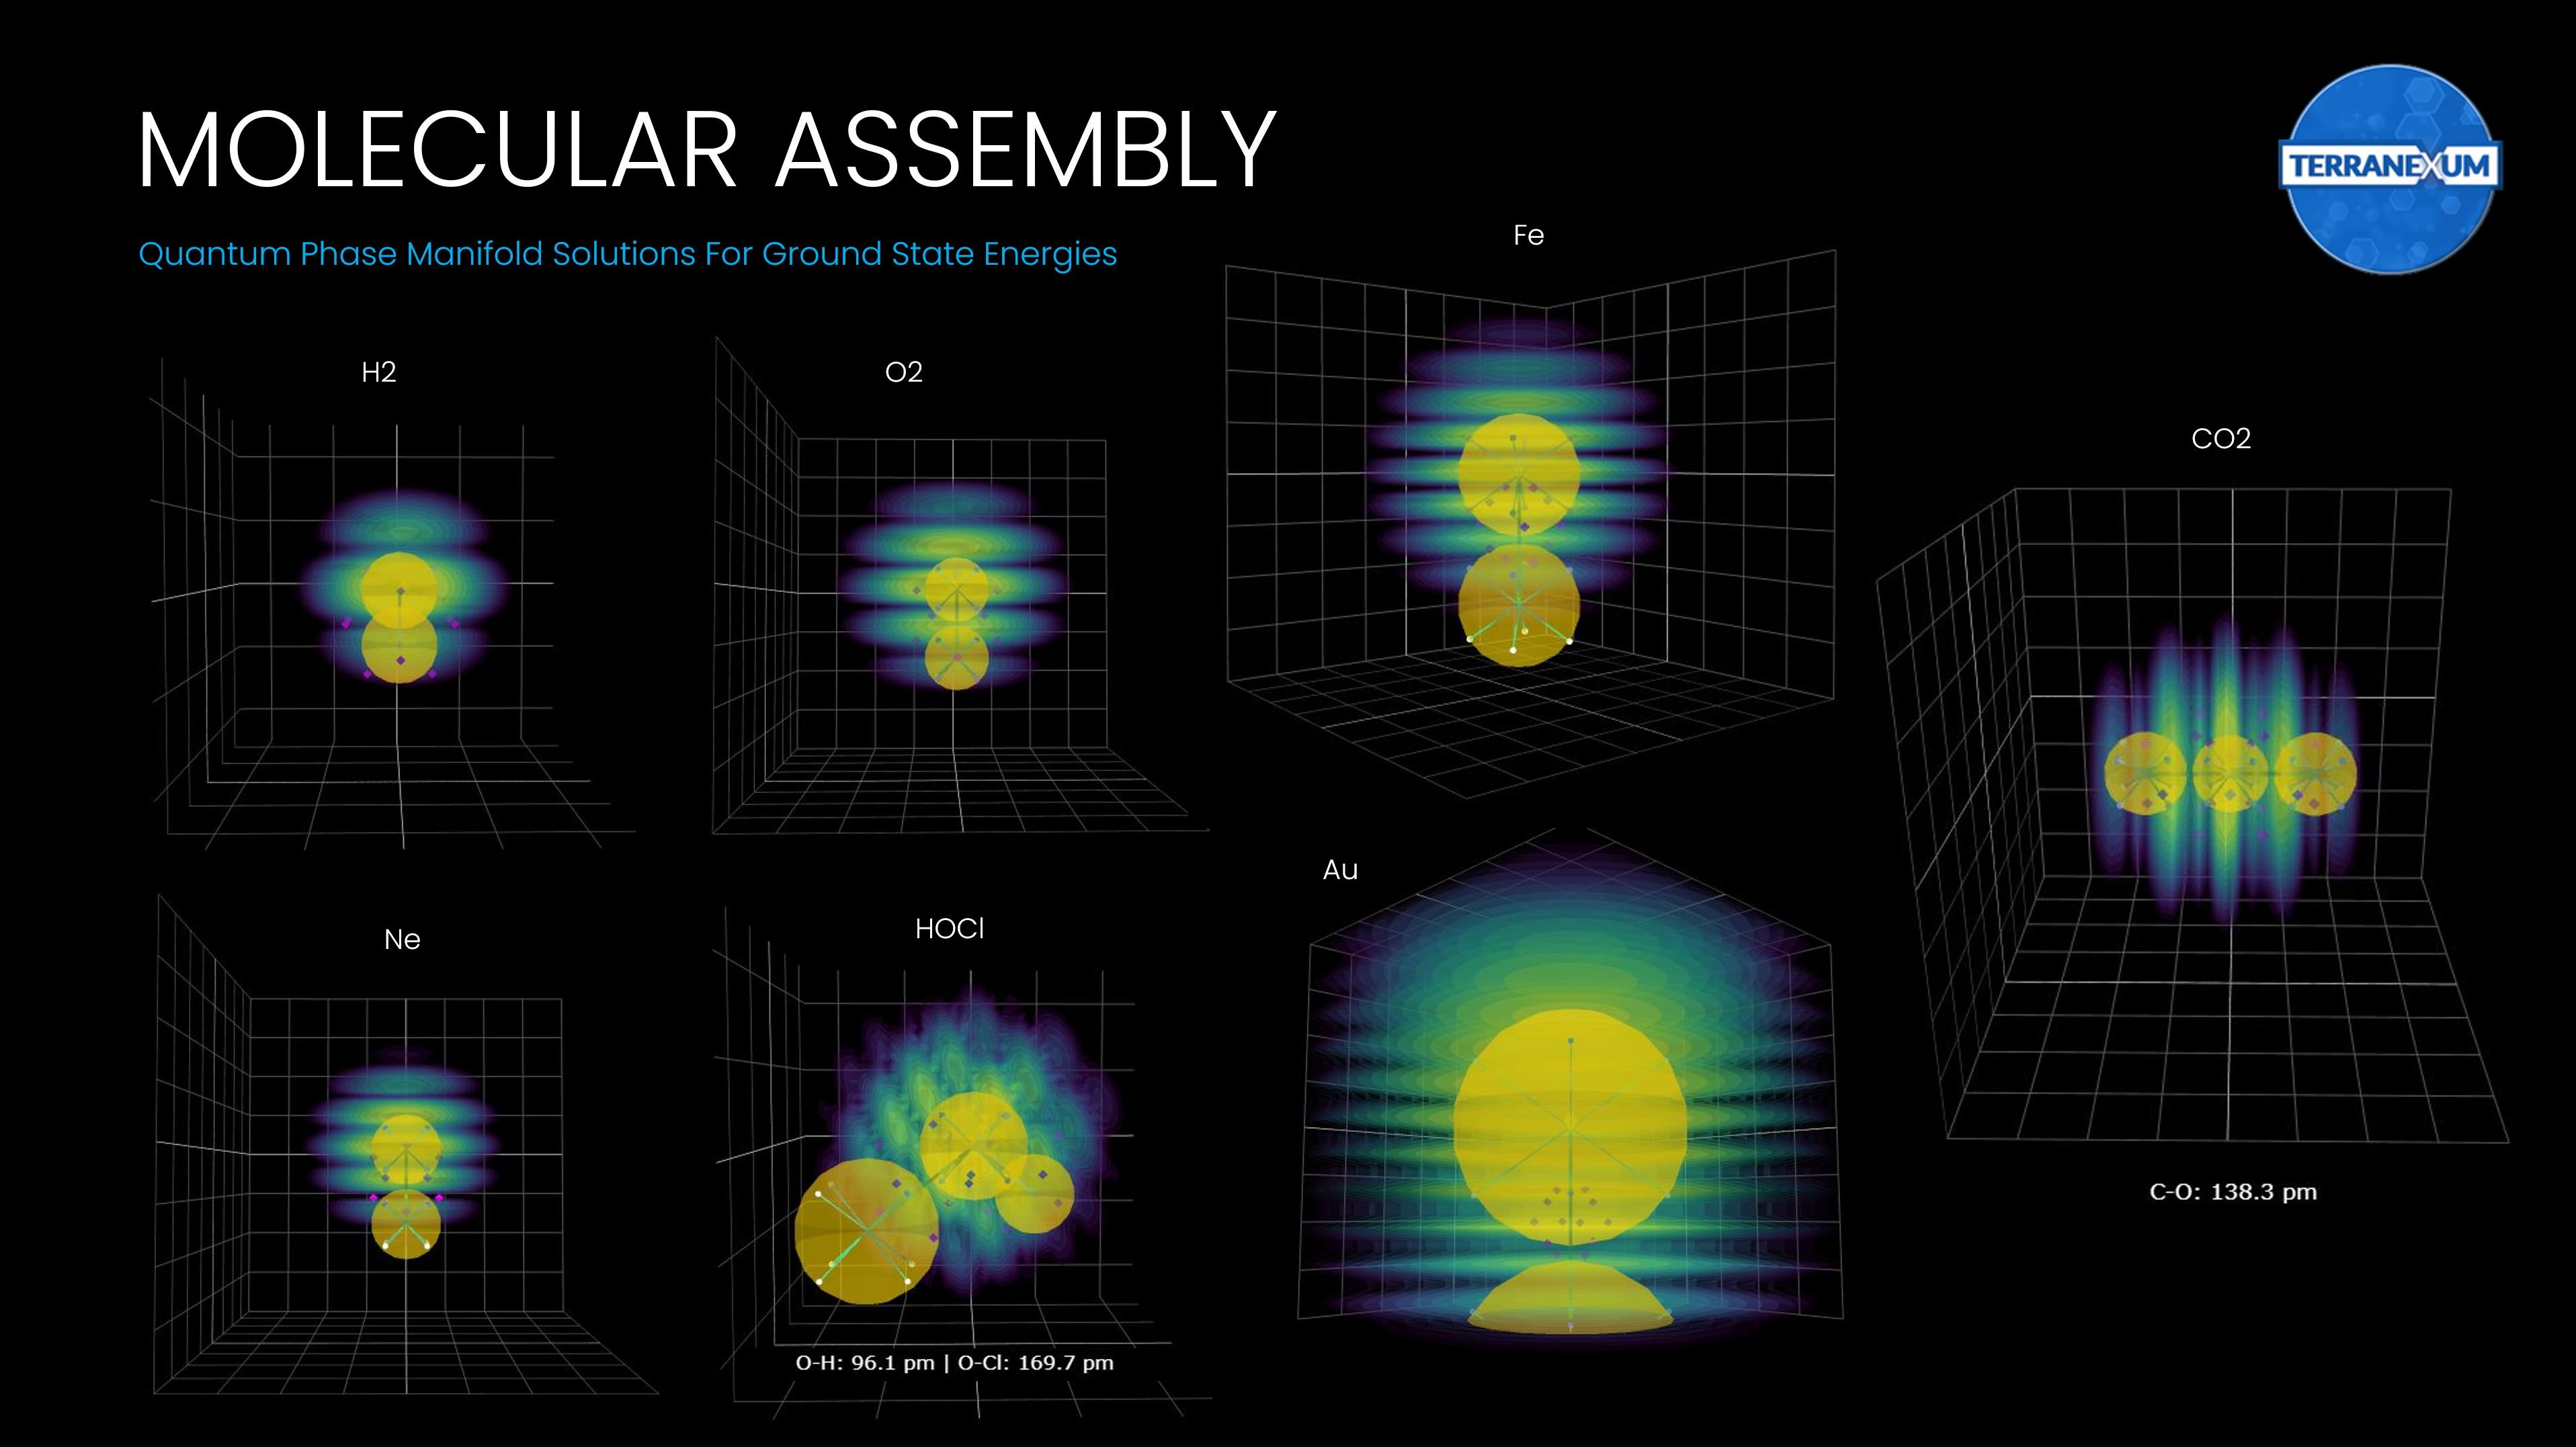
CO2 is the form that carbon takes in the air when it is no longer a building block of current or former life. Oscillations in atmospheric CO2 occur on daily, seasonal, and annual cycles, continuing to rise from there being more sources than sinks.
Stabilizing the climate requires stabilizing carbon turnover - helping it to find more new homes as living biomass or minerals than are lost.